K-means Cluster Analysis
This is based on a tutorial by Prof. Hans Peter Blankholm.
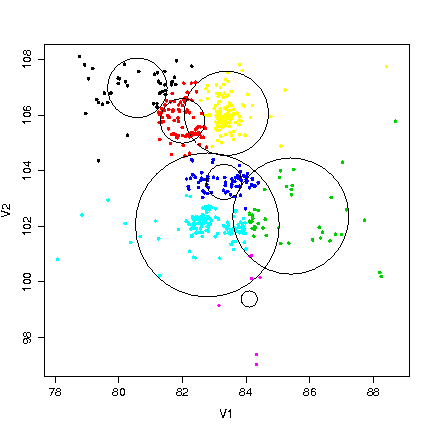
Start a new R session. Import your data file containing the XY coordinates of your objects, one per line.
bc <- read.table("blackche.adf")
bc.km <- kmeans(bc,7)
plot(bc, pch=20, col = bc.km$cluster)
symbols(bc.km$centers, circles = bc.km$withinss, add, TRUE)